Growth
Reports
Eight tabs covering the enquiry funnel, the week, centres, demand, consultants, speed, surveys and pick lists. Every tab filters by period, centres, brand and consultants.
Overview
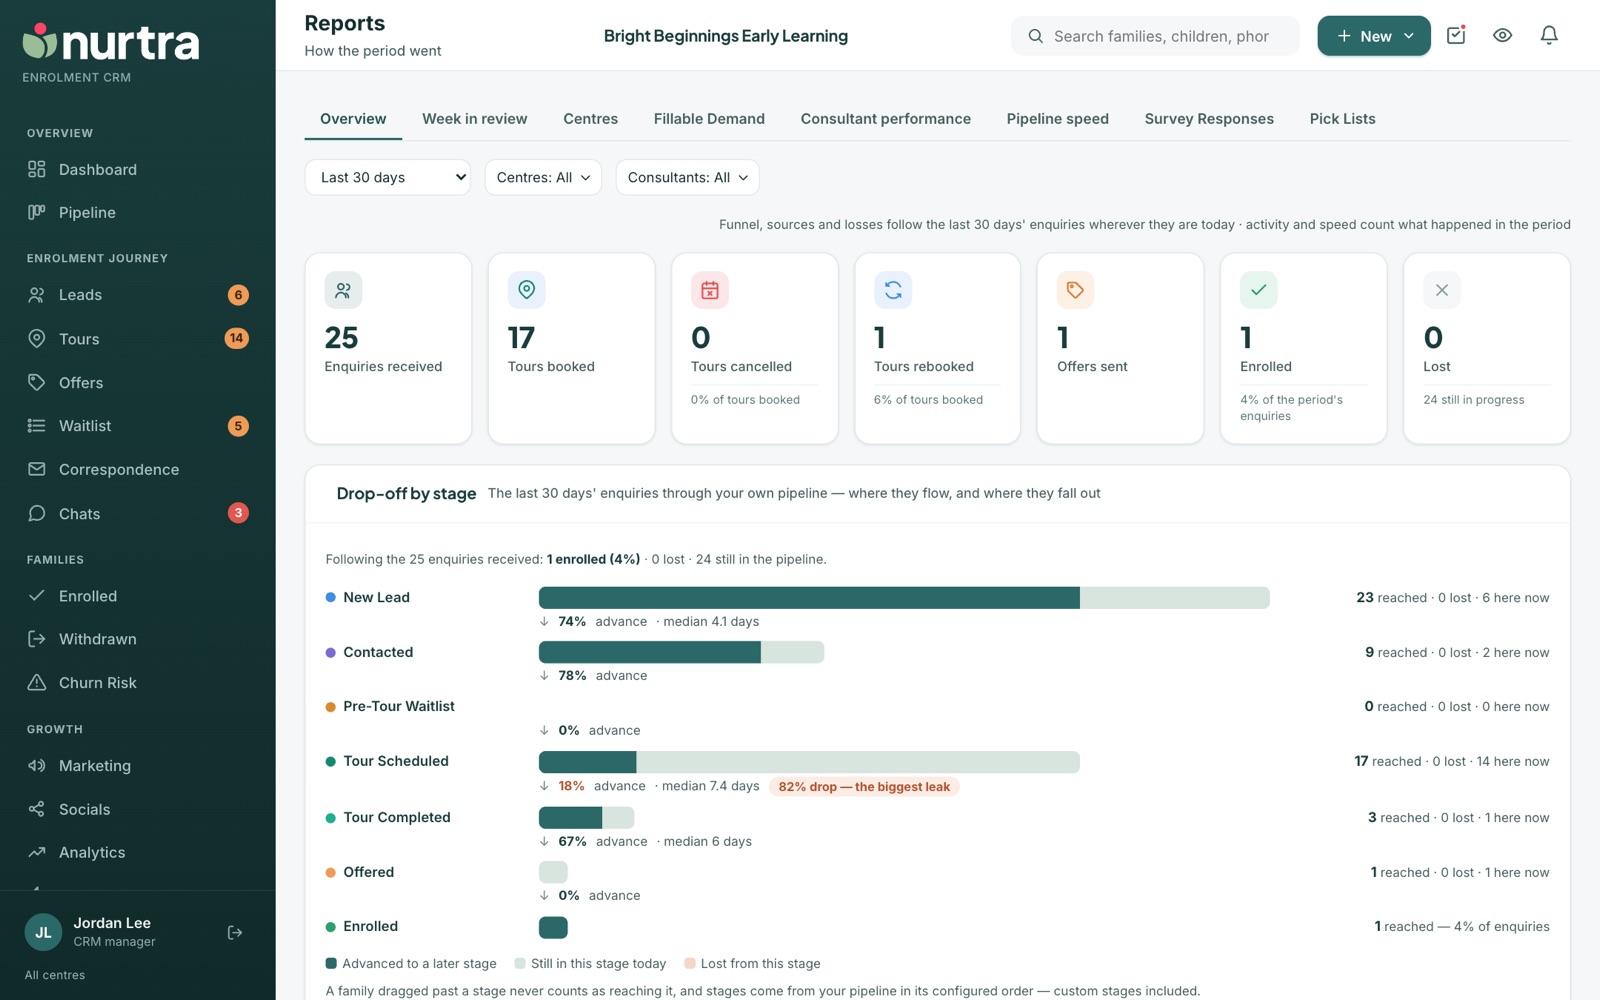
- Tiles: enquiries received, tours booked, tours cancelled, tours rebooked, offers sent, enrolled and lost.
- Drop-off by stage: the period's enquiries through your own stages in order, showing how many reached, advanced, are still there or were lost at each, with the biggest leak flagged.
- Source performance: enquiries and enrolments by channel.
- Where families were lost: the stage, the reason and the consultant's note.
- Speed to enrolment: enquiry to accepted offer.
Week in review
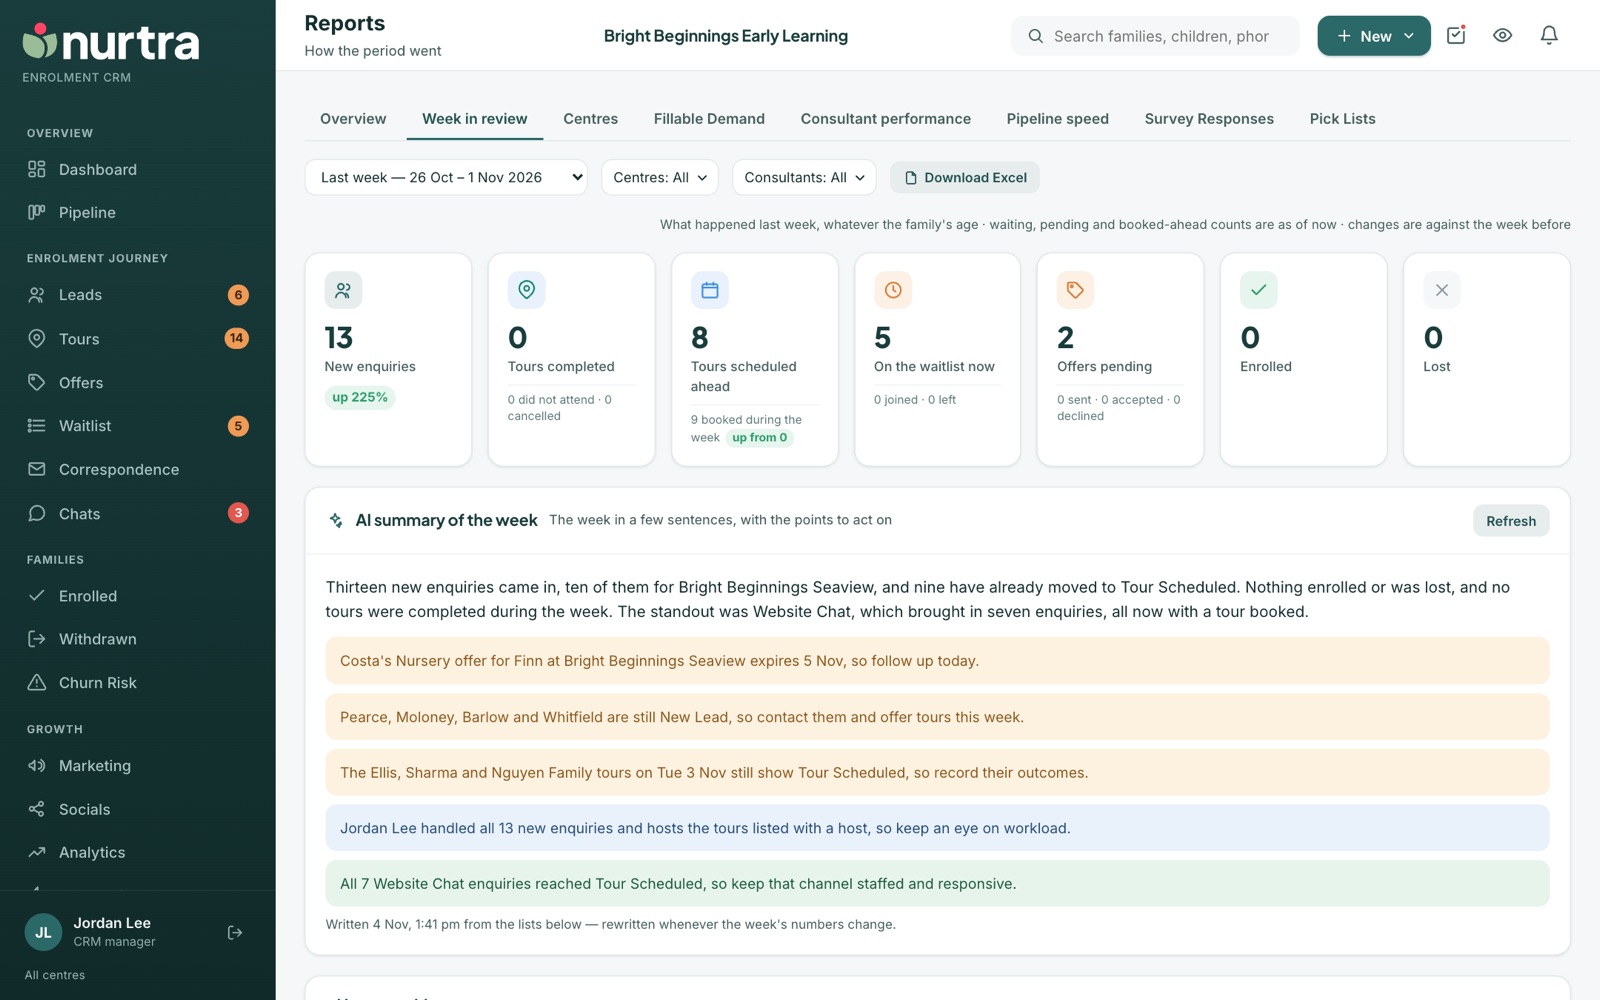
- Pick a week. See new enquiries and where they stand now, tours, the waitlist, offers, enrolments and losses.
- Each tile shows its change against the week before.
- An AI summary gives a few sentences on the week and three to five points to act on.
- Download Excel writes it all to one workbook, with the summary on its own sheet.
Centres
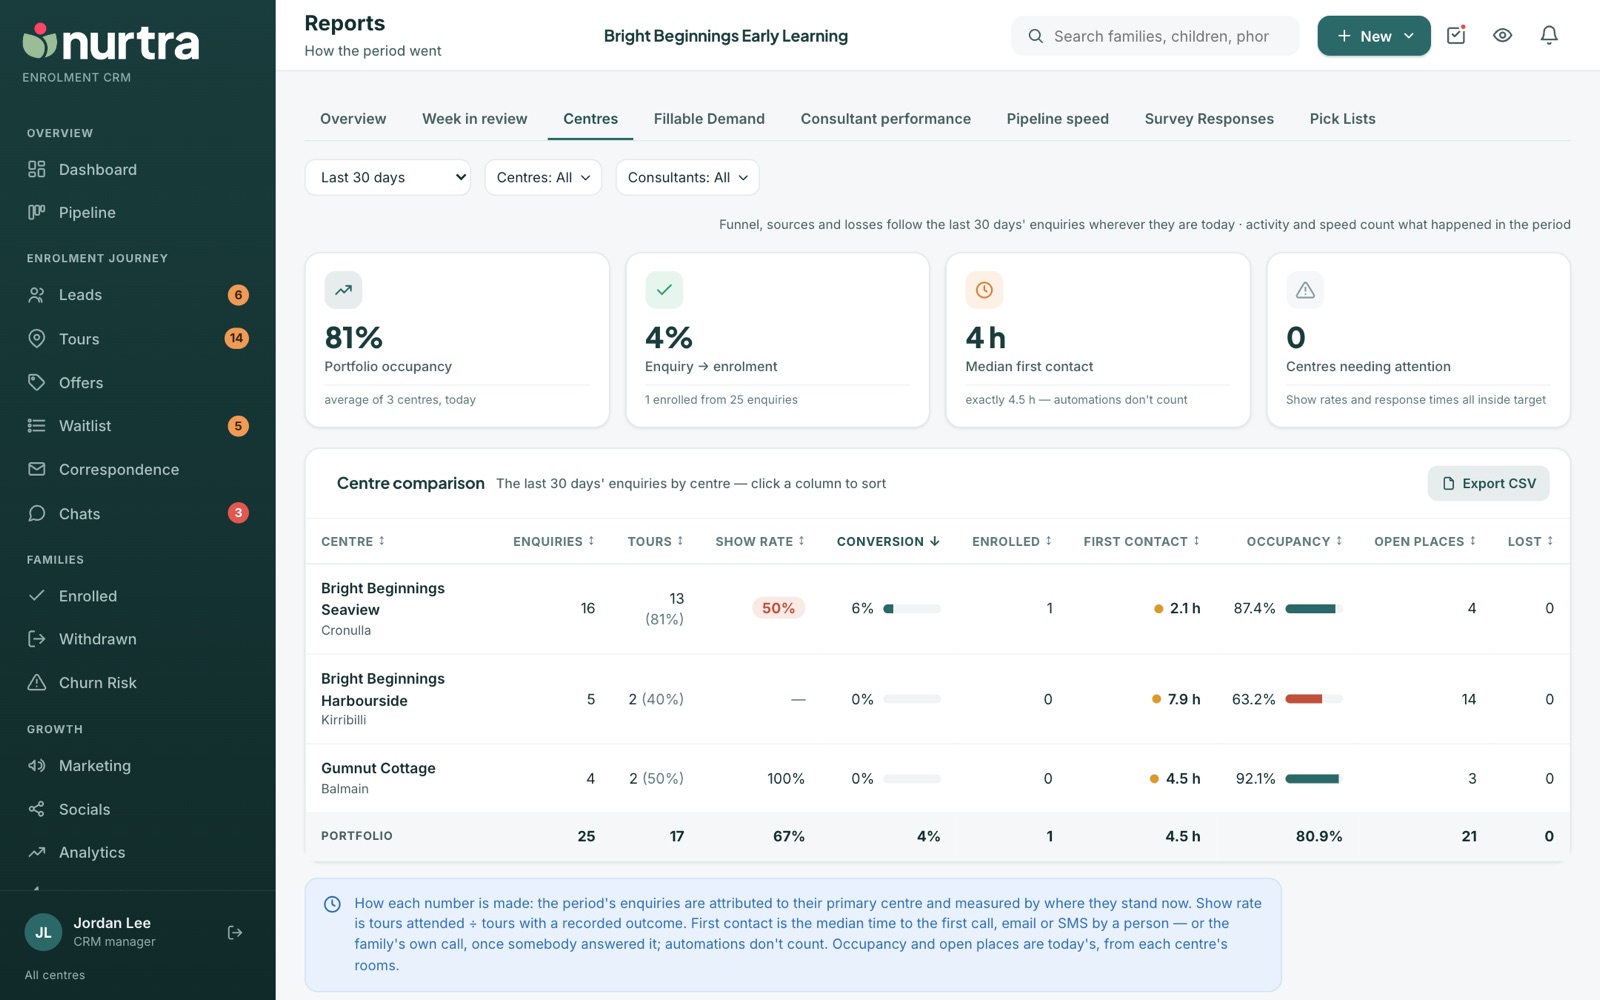
- Portfolio occupancy, enquiry-to-enrolment rate, median first contact and centres needing attention.
- A comparison table per centre: enquiries, tours, show rate, conversion, enrolled, first contact, occupancy, open places and lost. Click a column to sort; Export CSV for board packs.
- First contact is the median time until a person (not an automation) called, emailed or texted, coloured against a two-hour target.
Fillable Demand
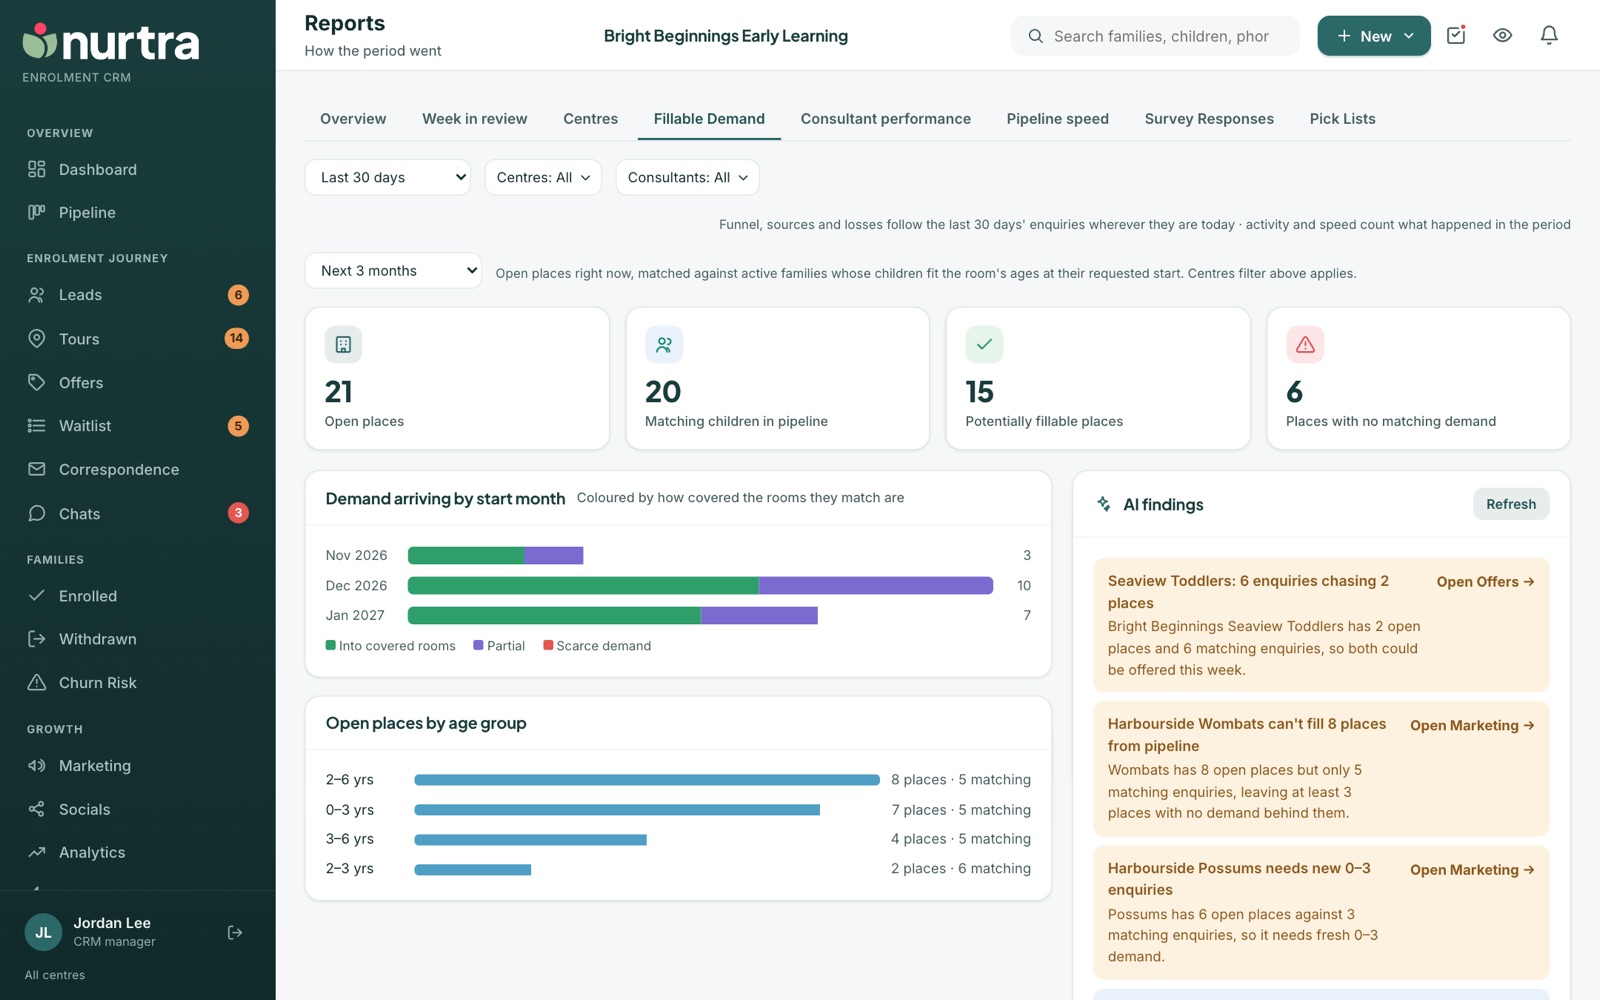
- Open places matched against active families whose children fit the room's ages at their requested start, over 3, 6 or 12 months.
- Demand by start month, open places by age group, and AI findings on where to act.
- Days families are asking for: pipeline demand by weekday, with flexible families counted separately.
Consultant performance
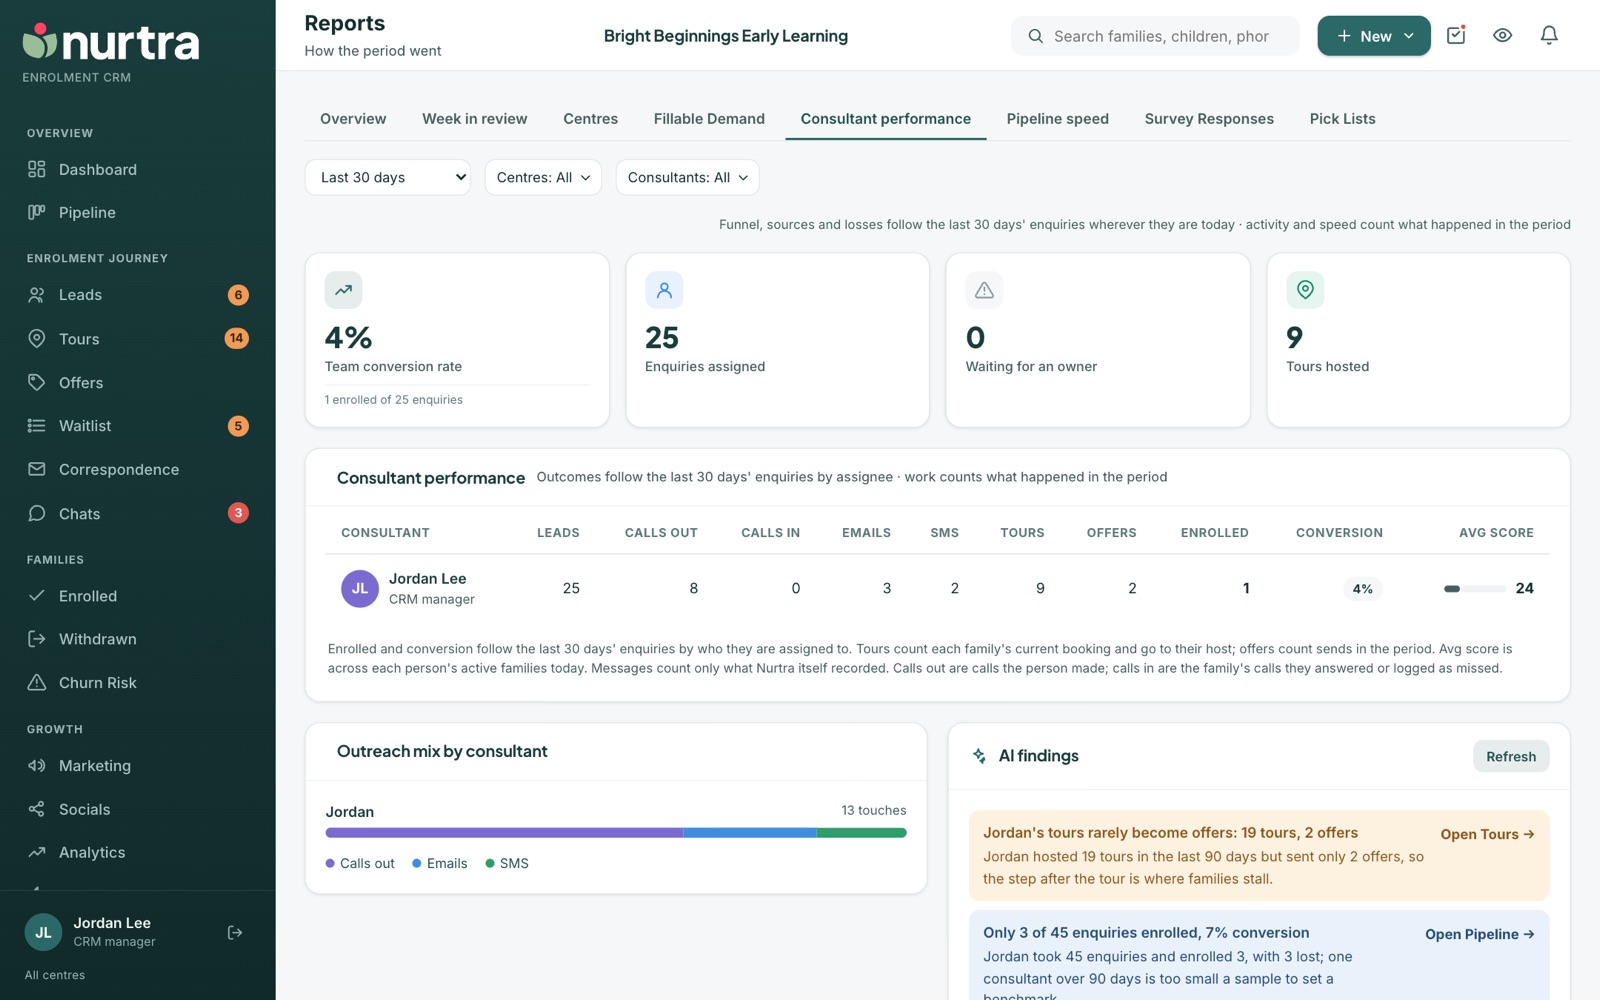
- Team conversion, enquiries assigned, enquiries waiting for an owner and tours hosted.
- Per consultant: leads, calls out and in, emails, SMS, tours, offers, enrolled, conversion and average score.
- Outreach mix chart and AI coaching findings.
Pipeline speed
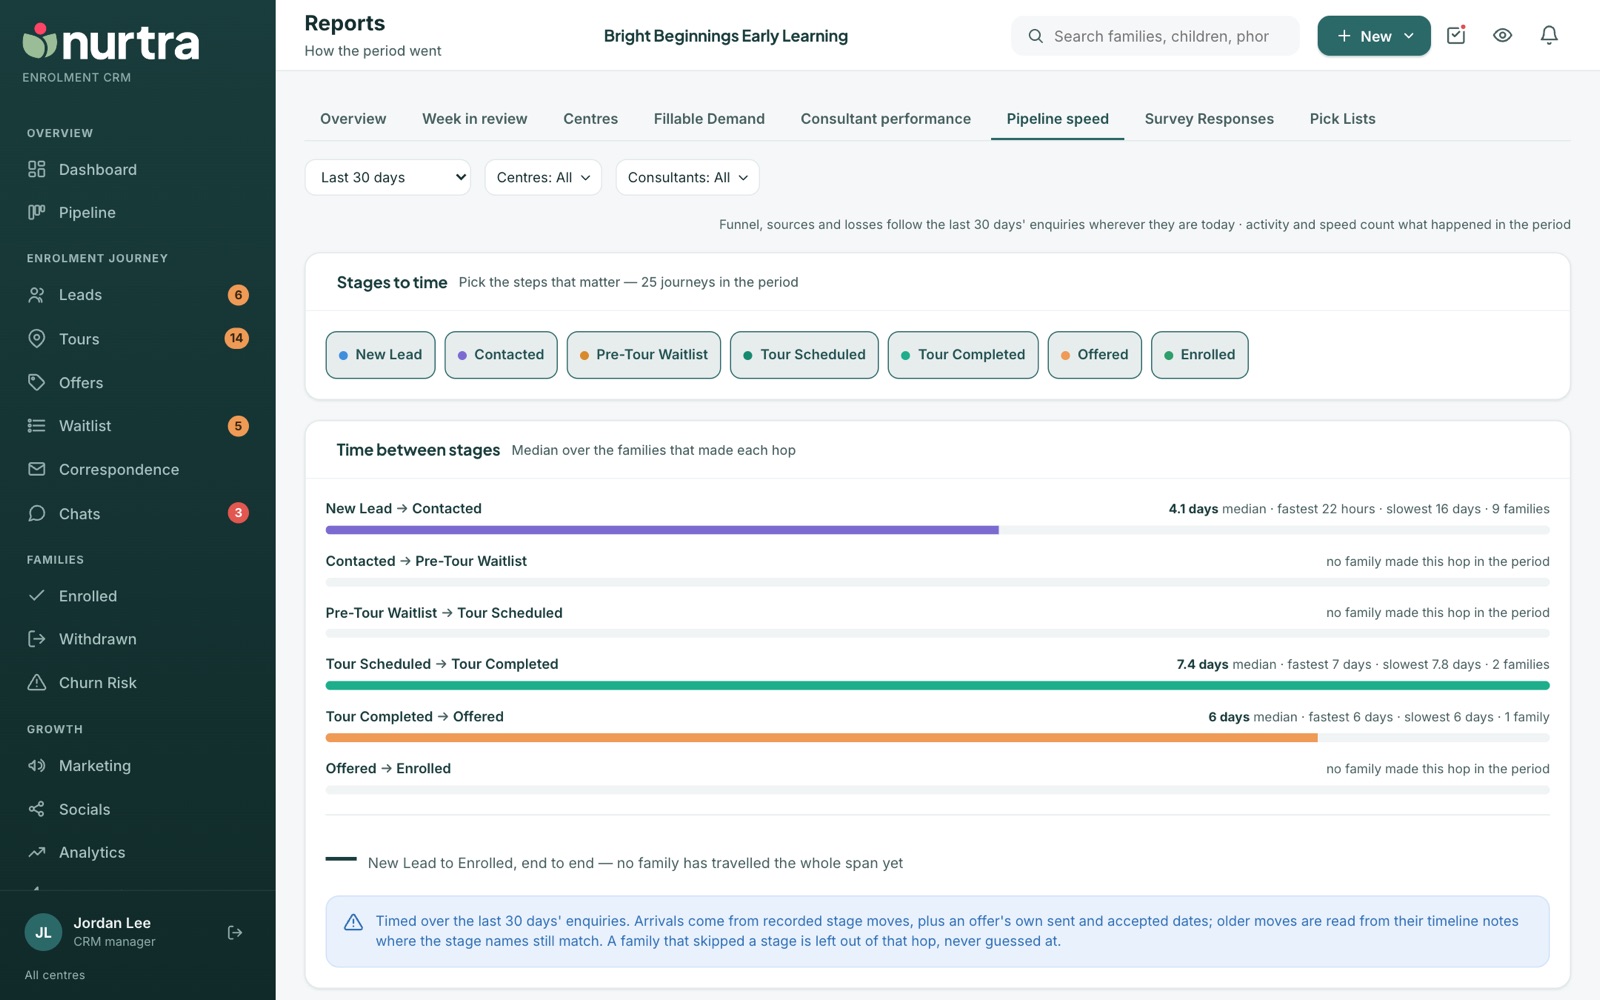
Pick the stages that matter and see the median time between each, plus New Lead to Enrolled end to end. Families who skipped a stage are left out of that hop.
Survey Responses
Answer breakdowns per question for each survey, plus an AI analysis of what families are saying.
Pick Lists
Counts the period's families against Source, Lead Attribute/Tag, Lost reasons, Enquiry reasons and Additional needs. Labels no longer on the list are still counted and marked.
Updated 2026-11-06 · nurtra.ai